
If 1,000 canary requests pass, I’d still ask what failure the test had a realistic chance of seeing. If the defect hits one in 10,000 requests, a clean run of that size is the likely outcome even with the defect present.
A rollout plan usually starts with an exposure limit. I want a second number on it, the minimum amount of relevant traffic I need to see before the next decision. The two numbers move against each other when the canary is small.
Small enough to contain, large enough to observe
Google’s SRE Workbook uses a simple example. A candidate fails 20% of its requests and receives 5% of traffic. With a clean control, the fleet-wide error rate is 1%. Segmenting by version reveals the failure much more clearly. Those are teaching inputs. They show how a small rollout can limit damage and how a fleet average can obscure what’s happening to the canary. Google SRE Workbook, Canarying Releases
Cloudflare’s November 18, 2025 outage shows how this reasoning extends to generated configuration. The company regenerated a Bot Management feature file every five minutes. A bad file crossed a runtime limit and was distributed across its network. Cloudflare reported mitigating the main impact at 14:30 UTC and restoring all operations at 17:06 UTC. Its subsequent account describes moving to progressive configuration deployment with health checks and using a last-known-good configuration where possible. A staged rollout still needs a way for consumers to keep serving after rejecting a bad candidate. Cloudflare’s incident report · Cloudflare’s rollout follow-up
The sample size has a cost
Suppose every request independently has probability p of hitting a defect and detection is perfect whenever that happens. The probability of seeing at least one failure in n requests is 1 - (1 - p)^n. At one failure per 10,000 requests, 1,000 canary requests give you a 9.52% chance of seeing one. It takes 29,956 requests to raise that chance to at least 95%. At one failure per 1,000 requests, the corresponding requirement is 2,995. These are scenario results. A noisy metric that needs multiple events to move demands more evidence.
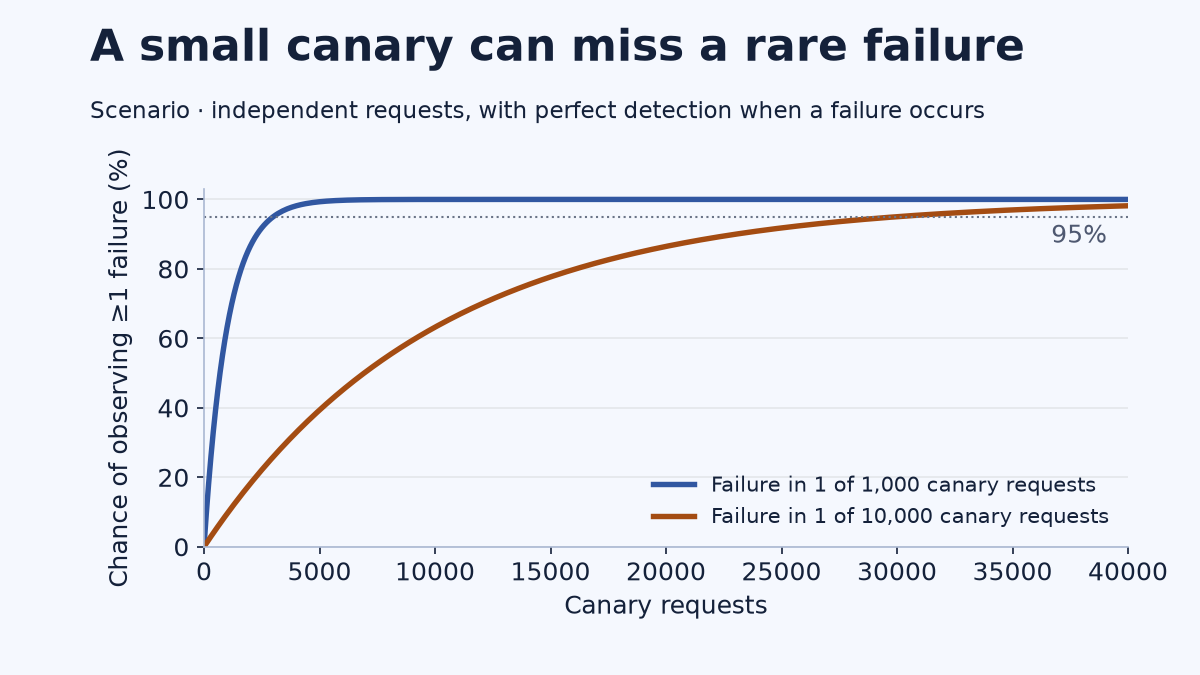
Illustrative detection probabilities for independent requests. The dotted line marks a 95% chance of seeing at least one failure.
At 100 requests per second across the service, a 1% canary gets about one request per second. The 29,956-request case would take a little over eight hours at that rate. If the defect only hits a path the cohort barely exercises, the relevant clock runs slower. And if requests come in correlated bursts from a single customer, raw request count can make coverage look better than it is.
I would set a minimum sample for the critical paths, keep a concurrent control, and give the release a hold state when it lacks evidence. If a particular account type carries the risk, use a representative cohort or run an explicit test for that path. Waiting longer on the wrong population just collects more of the wrong data. If the failure comes from a shared dependency, stage by a boundary that contains the effect before relying on percentages at all.
A deadline can tell you when to stop waiting. The decision to expand needs to say what the canary actually saw.